As organizations generate and store more data, managers face increasing challenges to make sense of it all. To meet this need, Data Visualization with Power BI, by business intelligence expert Alex Kolokolov, provides a detailed yet accessible framework that turns data into visual stories. Power BI is more than just a tool; it’s a way for managers and specialists to take control of data, allowing for better reporting, clearer insights, and more effective planning.
Power BI: A Tool for Managers and Teams Alike

For managers in industries ranging from finance to marketing, quick access to insights is critical. Alex Kolokolov’s new book equips professionals with the skills to translate raw data into actionable insights, all within the user-friendly interface of Power BI. With Power BI, managers can build interactive dashboards that provide real-time views into performance metrics, from sales to expenses to customer satisfaction. These dashboards are customizable, allowing managers to focus on metrics that matter to their specific goals.
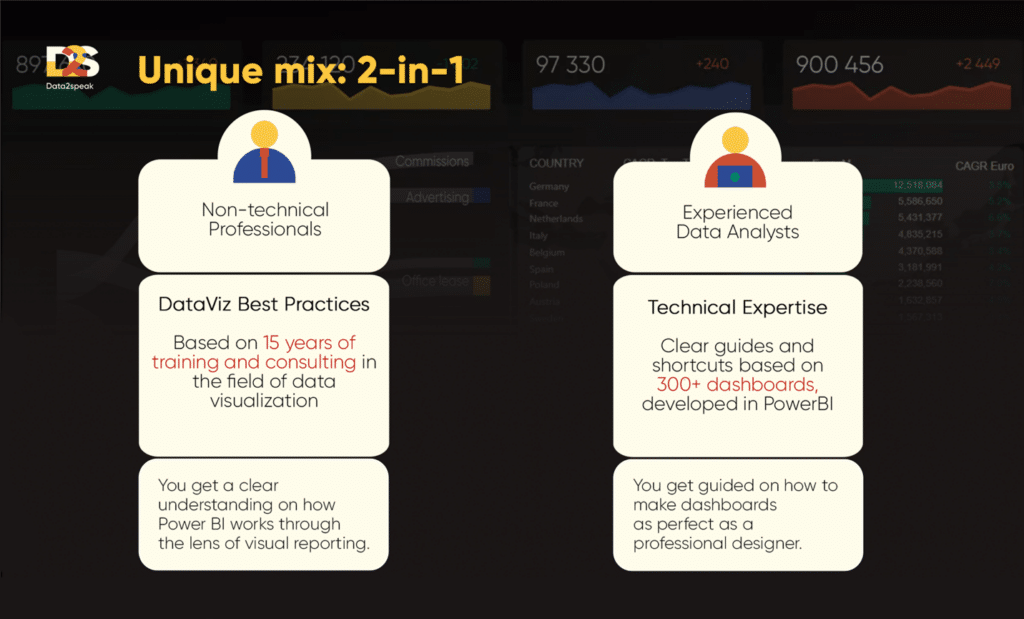
Microsoft’s ecosystem is rich with resources, but many are geared toward technical specialists, leaving non-technical users to struggle with tools like Power BI. Often, business professionals without an IT background try to navigate Power BI only to find it overwhelming and confusing. Alex Kolokolov observed this issue and set out to create a more user-friendly approach, one that would help “everyday” professionals use Power BI confidently. His book, Data Visualization with Power BI, is built on this foundation. While many books cover data visualization or the technical aspects of Power BI, the author’s work stands apart by tailoring valuable techniques specifically for non-technical users. This isn’t a basic beginner’s guide; it’s a professional resource designed for managers and business users who need accessible yet effective guidance on creating meaningful data visualizations without getting lost in technical jargon.
Bringing Data to Life
A key challenge in Data Visualization with Power BI is the tendency among even seasoned data professionals to create reports that simply meet client requests without enhancing the final product. Many clients, rooted in traditional Microsoft Excel methods, often want to see data displayed in familiar formats—spreadsheets, tables, and dropdown-heavy layouts reminiscent of outdated reporting styles. In today’s fast-paced business environment, however, professionals can go beyond static views to create interactive dashboards that enhance functionality. This book empowers readers to guide clients toward effective methods, creating efficient, intuitive visuals that save time and improve insight quality. This is the shift in data reporting that I hope to bring to the mainstream.
What Makes This Book Stand Out?
- Three-Part Visual Structure: The author organizes Power BI’s visuals into three distinct categories—Classic, Trusted Advanced, and Risky Advanced—to guide users through the selection and design of impactful visuals. From basic charts to unique visuals like Sankey diagrams, each type has a specific purpose and application.
- Business-First Approach: Data Visualization with Power BI is filled with real-world examples and scenarios that demonstrate the practical value of each visual. Instead of focusing solely on the technical aspects, A. Kolokolov emphasizes how each visual can be used to tell a story, helping managers make sense of the numbers and drive results.
- Non-Technical User Focus: Power BI is often daunting for non-technical users. Alex Kolokolov addresses this by providing clear, step-by-step guides written with the everyday manager in mind. This means that even those with minimal experience in data analytics can start building meaningful dashboards that improve productivity and decision-making.
- Reducing Report Overload: Many managers are familiar with report overload. The book demonstrates how Power BI’s dashboards consolidate information, replacing the need for dozens of individual reports and providing clear, consolidated views that drive faster, more confident decisions.
Alex Kolokolov’s book is essential reading for managers and team leaders who need to keep pace with data in today’s business environment. By making data visual, actionable, and accessible, Data Visualization with Power BI turns reporting from a chore into a strategic asset.
Published by Mark V.


