
By: AK Infinite
In the heart of every city lies its downtown, a bustling center where life, culture, and commerce intersect. Amidst the constant motion, the landscape of downtowns evolves, shaped by the symphony of real estate development. Yet, for many, understanding this symphony can be akin to navigating a labyrinth without a map.

Photo Courtesy: Gingko
Enter the transformative power of interactive maps showcasing real estate development activity. More than mere tools for data analysis, these maps offer a narrative about where, why, and how downtowns are evolving. They provide insights into opportunities and enable stakeholders to participate in city-building.
The Problem Scattered Information
Finding information about development in a town or city often involves stumbling upon scattered news articles with architectural renderings. These articles lack geographic context and detailed project information, leaving readers without a clear understanding of opportunities and site locations. Without maps, understanding the evolving landscape of downtowns becomes challenging.
Moving Toward Progress: The Power of Interactive Maps
Imagine navigating the virtual streets of your downtown district armed with a digital compass guiding you through development projects. With a few clicks, you unveil a mosaic of colorful pins representing a range of ventures, from towering skyscrapers to quaint boutiques. Interactive maps provide a comprehensive view of growth and potential, offering insights with every interaction.
For Residents: Engaging with the Future
For residents, interactive maps offer glimpses into the future while grounding them in the present. These maps facilitate community engagement, allowing residents to voice concerns, share their vision, and actively shape their urban environment.
For Developers & Investors: Clarity and Confidence
Investors and developers find clarity and confidence in interactive maps. Real-time data on development pipelines, market trends, and regulations help them navigate opportunities precisely.
“For real estate investors and developers, having access to clear and reliable information is essential for making informed investment decisions. Typically, understanding and monitoring submarket changes demands extensive resources. Interactive maps, however, offer instant insights into the ever-evolving dynamics of local supply and demand. These tools not only track the progress of development projects but also provide ground-level details such as new business openings, infrastructure enhancements, and streetscape changes—layers of data that are otherwise challenging to integrate.” – Brian Hong | Chief Operating Officer, Twining Properties
For Government Agencies: Transparency and Accountability
Local governments benefit from the transparency and accountability that interactive maps bring. By making real estate development activity accessible to the public, they foster trust, promote civic engagement, and streamline decision-making processes.
For Civic Organizations: Bridging the Gap
Civic organizations play a crucial role in bridging the gap between aspirations and achievements. Interactive maps facilitate connections, guide progress, and turn abstract visions into tangible landmarks. These maps enable organizations to gauge local sentiment, foster public support, and drive community development.
For instance, New Rochelle, NY, showcases a development map on their website, highlighting downtown investment around the Metro North regional transit stop. While such custom websites are valuable, they can be expensive to develop.
Tech startup, Ginkgo strives to make developing these maps easy and accessible for any real estate company, government agency, or non-profit organization. Ginkgo’s platform provides a development tracking framework adaptable to any city, demonstrating the power of interactive mapping for aligning vision with reality in the city building process.
LONG ISLAND CITY
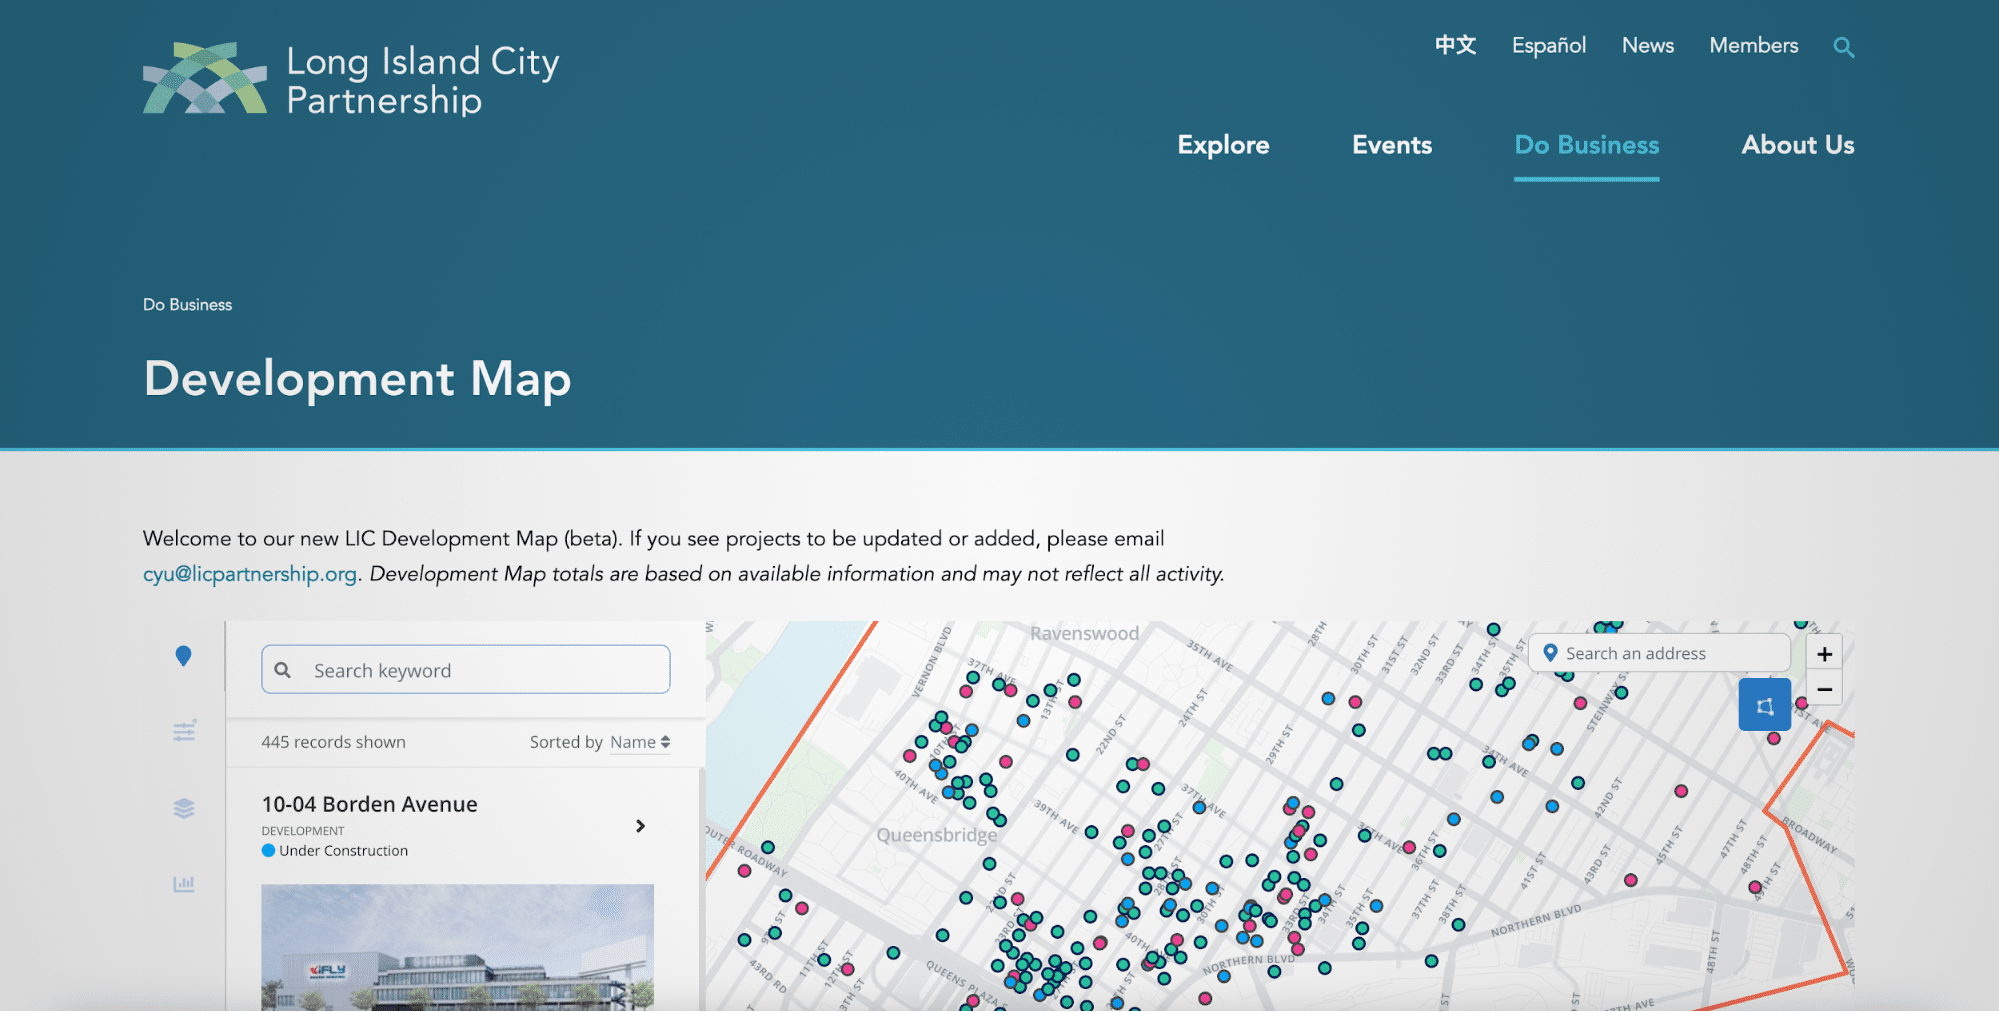
Photo Courtesy: Gingko / Long Island City Partnership
“The transformative impact of such readily available information on Long Island City (LIC) exemplifies a successful model that other cities can easily emulate using powerful, yet highly affordable tools like Ginkgo.” – Brian Hong | Chief Operating Officer, Twining Properties
Using Ginkgo, Long Island City Partnership takes this beyond purely a map of projects. The LIC team integrates their Ginkgo development data into various reporting tools, brochures and other resources used to provide a clear “Neighborhood Snapshot” to anyone looking for better insight into where, why, and how LIC is developing into the next great downtown.

Photo Courtesy: Gingko
LIC “Neighborhood Snapshot” powered by Ginkgo for the mapping and data analysis and using Looker Data Studio for added charts and visualizations.
“Ginkgo’s mapping platform allows us to keep track of local development data comprehensively. With this support, we and our stakeholders can make informed decisions that contribute to long-term growth and enhance community resilience.” – Charles Yu | Vice President, Long Island City Partnership
In conclusion, interactive real estate development maps offer a window into the future of downtowns, fostering engagement, clarity, and progress. By harnessing the power of data and technology, these maps empower stakeholders to shape vibrant, sustainable communities for generations to come.
Published by: Martin De Juan